Top Betting Markets for Darts: Odds, Tips and What to Know Before You Wager
OtherSaturday, 10 January 2026 at 10:59
Luke Littler’s second consecutive world title has reset the betting landscape for the year ahead. As you look at the markets shaping 2026, the key is understanding how each one works and how player tendencies influence the odds.
ADVERTISEMENT
The new season begins in the shadow of another pulsating World Darts Championship at Alexandra Palace. Littler’s 7-1 victory over Gian van Veen in the youngest final ever produced a surge of interest from bettors who want clearer insight into where value lives. The reaction has been extraordinary. Littler’s influence has moved darts into full mainstream territory, where audiences are not only following the Premier League and Pro Tour but exploring the sport across wider corners of gambling culture.
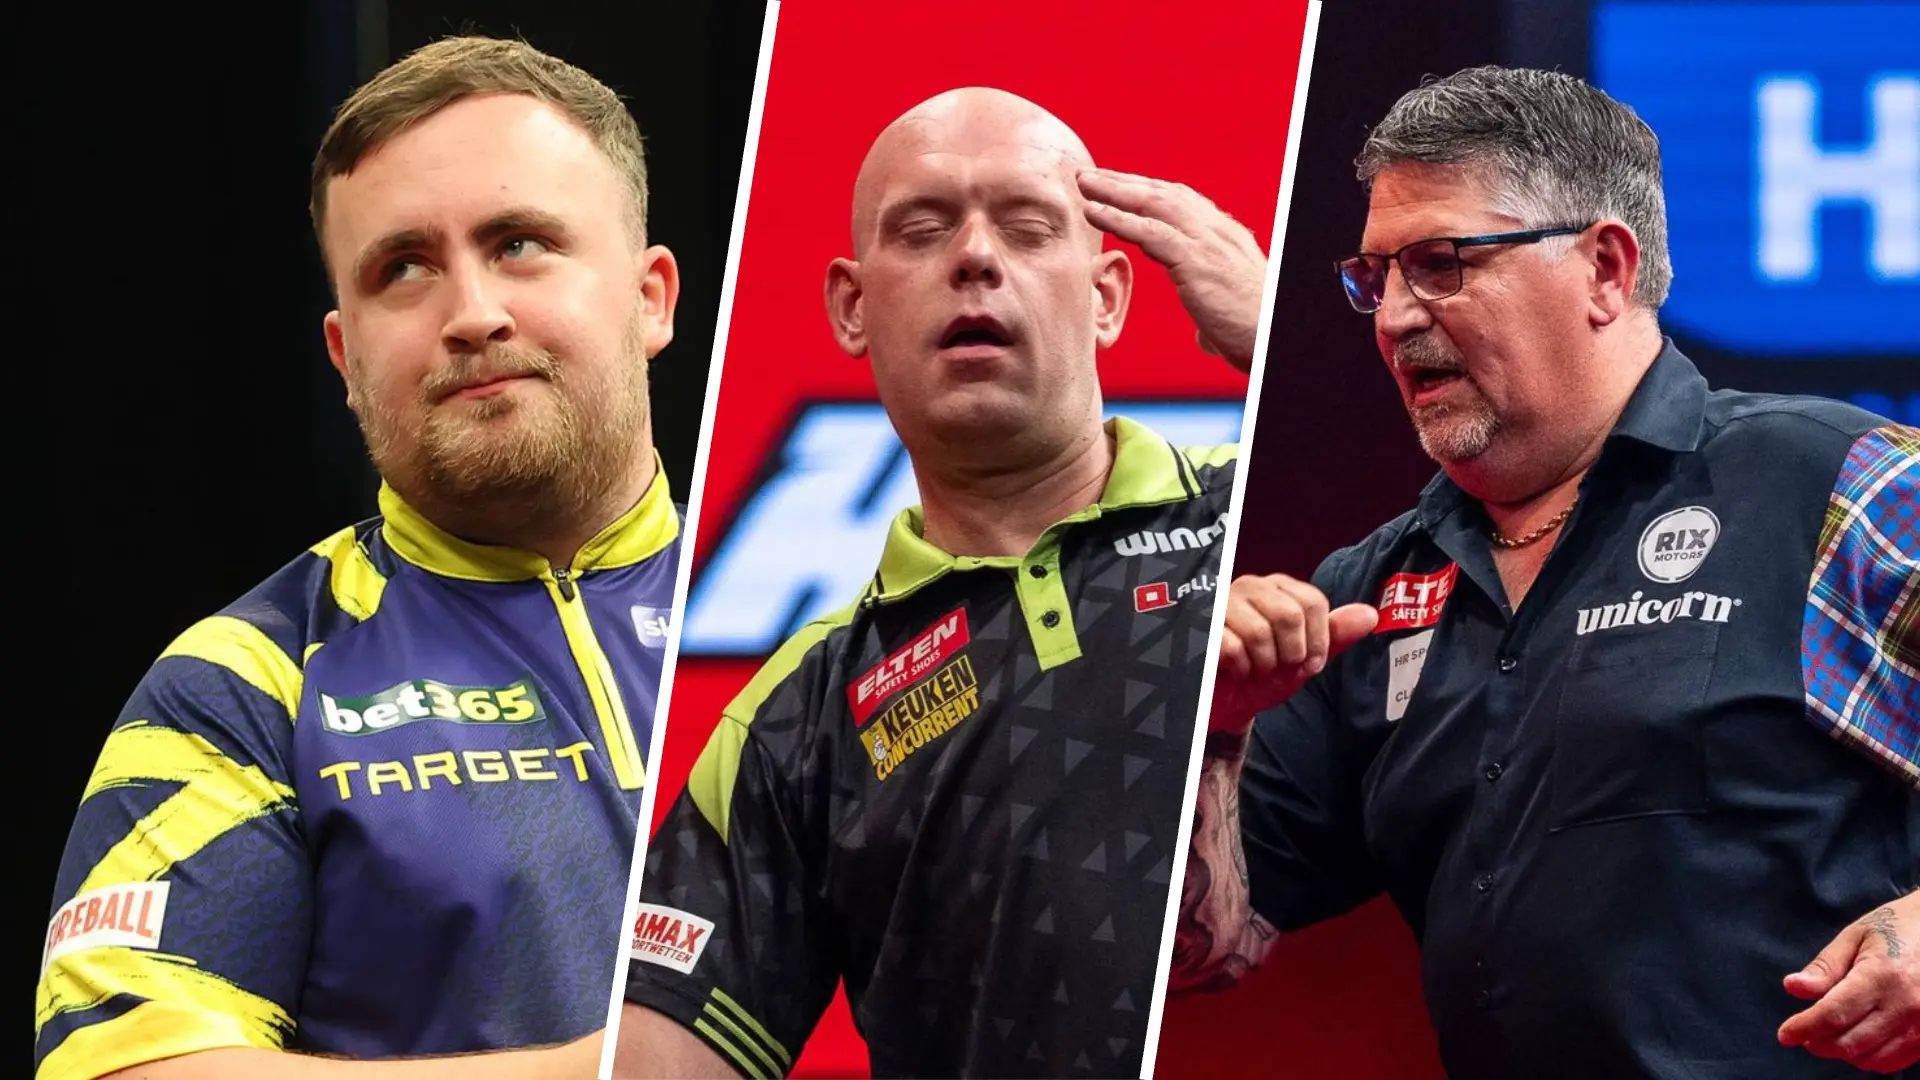
You see it in record Ally Pally attendance, in amateur leagues refilling after Christmas and in the way Littler and Van Veen clips dominate TikTok and Instagram. You even see it in digital gaming, where developers are now building titles inspired by the sport’s momentum. VegasSlotsOnline hosts several examples, including Darts Heroes, a Stakelogic slot built around an intergalactic tournament that features superpowered versions of Phil Taylor, Raymond van Barneveld, Michael van Gerwen and Gary Anderson. The game plays with low volatility and uses fast comic-book animation to recreate the competitive pulse of big-stage darts in a different setting. It shows how deep the sport’s reach has become and why more bettors want to understand how darts markets work before they place a wager.
The most common markets are match winner, set betting, total 180s, high checkout, correct score, outrights and in-play. Once you understand how they function and what influences the odds, the sport becomes far easier to read.
Match Winner Markets and the Factors That Matter More Than Reputation
The match winner market is the simplest place to start because you are only choosing who wins the match, yet the simplicity can be deceptive. Underneath the surface is a set of numbers that explain why bookmakers price players the way they do.
Littler enters 2026 as the defining reference point. His 12-month average of 101.06 is the highest in the PDC and he is the only player currently finishing above the 100 mark across a full season. Luke Humphries follows with 98.68 and Van Veen with 98.27. A gap of two or three points over long formats often translates into a significant shift in win probability. In a best-of-seven match, a player with a five-point advantage in sustained scoring usually controls the direction of play.
Leg-winning percentages reinforce this. Littler wins 60.59 percent of legs across the year compared to Humphries at 56.48 and Van Veen at 58.59. Van Gerwen sits lower at 52.38 despite his long-standing reputation. These percentages highlight how efficiently each player converts scoring into legs won. They also show resilience. Littler wins 73.21 percent of legs when throwing first, which is why opponents struggle to turn matches around once he gets a foothold.
ADVERTISEMENT
When you place a match-winner bet, study three indicators together: the 12-month average, the legs-won percentage and how a player performs when the throw alternates. Those numbers reveal the difference between a justified favourite and an upset candidate.
Understanding Momentum in Set Betting and Why Some Players Recover Faster Than Others
Set betting asks you to predict the exact score in sets or choose a winning margin, and it becomes much clearer once you understand how players behave through long-format matches.
Littler’s semi-final against Ryan Searle at Ally Pally is the perfect example. He lost the opening set then won six straight. The numbers explain why that structure is normal for him. Littler wins 73 percent of legs on throw and almost 48 percent when returning. Those figures show a player who absorbs early damage without losing control of the wider match.
Van Veen sits close to that profile. He wins 71.60 percent of legs when throwing and 45.62 percent against the throw, which is elite-level balance. Humphries sits slightly lower but has the middle-gear rhythm needed to reverse deficits.
ADVERTISEMENT
When placing a set betting wager, focus on players who win above 45 percent of legs when returning. That ability to break throw consistently is what pushes matches toward 4-2 or 4-3 scorelines rather than quick one-sided results.
How 180 Totals Really Work and What Drives a High Line
The total 180s market asks you to predict how many maximums will be thrown either by one player or across the match. It relies heavily on scoring tempo. If you understand how fast a match is likely to play, you can often anticipate where bookmakers will set the line.
Littler drives the highest tempo in the sport. He has hit 919 maximums in the past 12 months and carries a first-nine average of 111.52. When he enters a match, the total 180 line rises sharply because the rhythm accelerates from the first throw.
Van Veen plays at a similar pace. His 615 maximums and 106.20 first-nine average create the same scoring pressure. When these two meet, the line climbs even higher because their combined rhythm produces more treble-heavy visits.
ADVERTISEMENT
Humphries adds another layer. His 584 maximums and first-nine average of 108.09 show how consistently he begins legs. Van Gerwen remains capable of exceptional bursts even if his output has leveled with age. Rob Cross and Michael Smith produce fewer peaks but still alter the line when they face faster opponents.
When betting on total 180s, study first-nine averages first. When both players sit above 105, the match usually produces a higher count.
What Finishing Data Tells You About High Checkout Potential
High checkout markets ask you to predict the highest finish in a match and rely on both accuracy and decision-making. It is not only about hitting a 140 or 170; it is about how often a player creates the opportunity to attempt one.
ADVERTISEMENT
Van Veen carries the most impressive stats in this regard. His 55.87 percent functional doubles rate is the highest among the elite group and shows he converts legs efficiently under pressure. That structure increases the likelihood of high checkouts because he remains in control when the chance appears.

Littler sits at 49.76 percent on functional doubles with an overall checkout rate of 43.43. That combination explains why he produces finishes like his 147 in the world final. He generates the scoring separation needed to attempt big checkouts and closes them at a level few can match.
Humphries finishes at 41.19 percent but attempts more century checkouts because he trusts his rhythm through the treble segments. Cross offers a predictable, steady finishing pattern. Smith remains streaky, which creates volatility in this market.
When approaching high checkout markets, look at two numbers: functional doubles and the highest checkout recorded in the past season. Anyone who has hit 160 or higher across the year is a live option.
ADVERTISEMENT
How Correct Score Markets Reflect Momentum Swings
Correct score betting asks you to pick the exact winning score in sets, and the key is understanding break patterns. A player who breaks early sets a match on a different trajectory from one where both hold consistently.
Littler is a prime example. Once he finds rhythm, he often pulls away through repeated breaks. Humphries tends to push matches into longer patterns but remains capable of turning sets against momentum.
Van Veen forces opponents into awkward patterns. His efficient finishing makes players lay up instead of attacking trebles, which produces tighter sets. Cross creates predictable patterns because of his stable throwing. Smith, however, can make matches chaotic as scoring streaks turn a contest suddenly.
Correct score betting becomes easier when you pair break percentage with pace. Those two indicators reveal whether a match is likely to collapse into a short result or stretch into a closer contest.
ADVERTISEMENT

Why Outright Prices Move Faster in Today’s Darts Landscape
Outright markets let you pick the tournament winner before or during the event. They rely on long-term form, big-stage performance and how often a player reaches deep rounds.
Littler’s back-to-back titles anchor his price. His 101.06 average forms the base of his probability. Humphries remains the most reliable challenger with a steady profile suited to long tournaments. Van Veen is rising fast. Van Gerwen remains a contender because of experience but his numbers show a player who no longer overwhelms every match.
When studying outrights, focus on players who win above 45 percent of legs against the throw. That ability keeps them alive through difficult draws.
ADVERTISEMENT
Understanding How a Match Breathes When You Bet In Play
In-play betting in darts is straightforward. Prices move after every visit, so you react to what is happening in the leg as it unfolds. A big visit, a missed treble or a sudden gap in scoring will shift the line within seconds.
When Littler scores above 100 against the throw, you see the hold becoming fragile before the market fully adjusts. With Van Veen and Humphries early heavy scoring forces opponents into different routes, and that is usually when the price starts to move.
Cross slows legs down and that change in tempo creates hesitation in faster players. Smith does the opposite. When he finds range, he speeds the leg up and the market often lags behind his scoring bursts.
For in-play bettors the first two visits matter most. They tell you which player is setting the pace, whether someone is recovering from a poor opener and if the leg is turning into a simple hold or something more vulnerable.
What to Look For as the 2026 Season Begins
The year begins with a clear hierarchy shaped by the world championship. Littler sits ahead of the field. Humphries remains the most complete challenger. Van Veen is closing fast with serious pace. Van Gerwen holds enough quality to trouble anyone on his night. Cross brings stability in high-pressure moments and Smith remains the most unpredictable player to price because of his streak-based rhythm. The depth at the top is becoming harder to ignore, and even Russ Bray has suggested that the current field is too strong and too varied for anyone, even Littler, to recreate the decade-long dominance Phil Taylor once produced.
When you look at the markets, build your decisions from the numbers. Scoring averages, first-nine pace and finishing percentages remain the indicators that hold up most reliably across formats. The more you study these patterns, the easier it becomes to see where odds reflect true probability and where you can find value.

Samuel GillChief Content Officer
Samuel Gill is the Chief Content Officer (CCO) of DartsNews.com, a role he has held since 2020. He is responsible for editorial governance across the platform, including setting content standards, overseeing accuracy and consistency, and guiding long-term editorial strategy across professional darts coverage. Since joining, he has contributed more than 10,000 articles and editorial pieces, playing a central role in the development and daily operation of the site.
Based in Leicester, Samuel has extensive experience in darts media and has been closely involved in coverage of the professional darts circuit for several years. Within the UK darts community, he is a recognised figure known for his consistent editorial output and ongoing reporting on major tournaments and developments across the PDC calendar.
In his current role, Samuel works closely with editors and writers to ensure content meets clear journalistic standards, with a focus on source verification, editorial consistency, and timely updates when new, confirmed information becomes available.
claps 0visitors 0
Just in


Popular news

Latest comments
- Sophie is an excellent player and an exciting talent. I would have thought such a talented player would certainly be ranked higher than 17. It will be great to see her back at Lakeside and hopefully becoming champion.richieburnettrocks21-07-2026
- How many times can fatty Bunting say listen, listen, listen....... I definitely don't want to see him for another 10 years, although looking at him, I don't think we will...you know what I mean.richieburnettrocks19-07-2026
- Don't worry Vinman, England will not be in the final.richieburnettrocks16-07-2026
- Ultimately, Vin man knew when to call it quits. Barney was excellent and one of the greatest darts player ever, but he just doesn't have that ability anymore. Vinman working in media is only saying what he thinks and I like how he doesn't sugar coat things and is completely honest and direct with his comments. Vinman will probably agree he wasn't really on the same level as Barney in their respective heydays.richieburnettrocks13-07-2026
- I agree that this season the format was a bit stale, it would be better to have some new faces rotated in through the season. I also think they should vary the format a bit as it doesn't count for rankings, they could have different varieties of 501 (e.g. double start) or just different challenges.mikedarts03-07-2026
- I don't really understand why its an issue that Littler doesn't play in the events, they are barely televised so there is no draw for marketing and it gives the other players a better chance to define their narratives. The events are more of a throw back to old events. I agree that the format should be looked at, I don't know why they don't do a more interesting format or vary it through the season to improve interestmikedarts03-07-2026
- This shows they have the prize money structure wrong then (and OoM as a result). Put more £ into the floor, less on the TV and you'll attract more players to attend more often.BandB03-07-2026
- He's admitted his mistakes. He won't be the first or last player to get sent down,or take drugs. I honestly didn't like the lad,but at least he's owning up to his issues. So,good luck. In whatever he decides to dorick6702-07-2026
- Not everyone wants to watch pub players throwing 70 averages for about £500. Premier League is indeed a cash cow, but it does its job of promoting the game. This new suggestion for changes is one of the better ones. Even better if everyone knew what they had to do to qualify and it isn't just a walk-on popularity contest.StraightArrowNoBull01-07-2026
- I have a suggestion,scrap the whole thing. It's a pointless cash cow for anyone in the top 10.rick6730-06-2026
Loading