Bad sign for Michael van Gerwen: remarkable 'curse' hangs over top seed at World Series of Darts Finals
PDC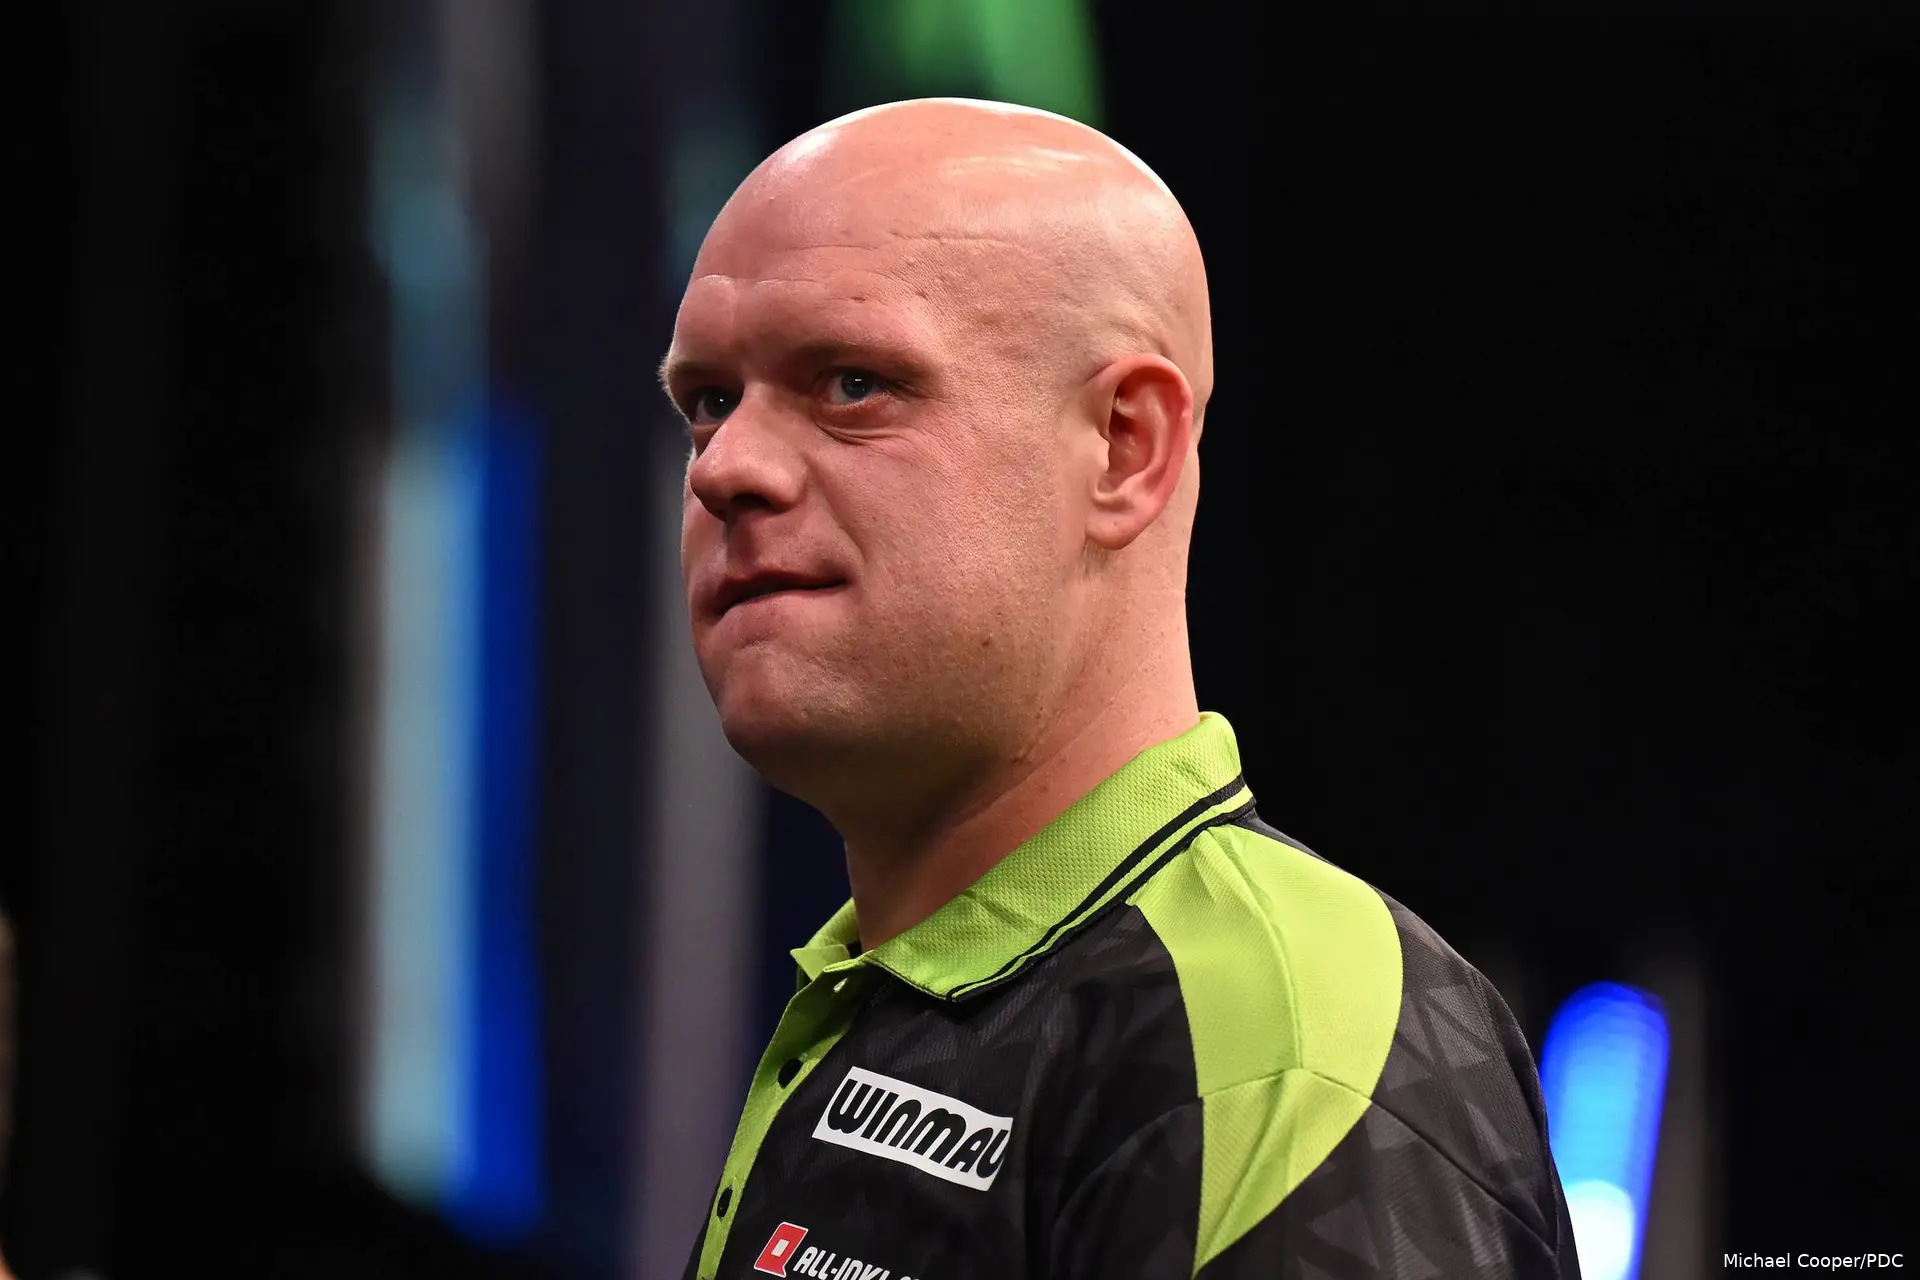
The World Series of Darts Finals has a unique ranking system where players are seeded based upon their performance across the year in respective World Series of Darts events. In 2026, Michael Van Gerwen ranks first, gaining 32 points over the season, but in other events this year, he has disappointed, seeing the Dutchman drop out of the top 4 for the first time since 2013.
ADVERTISEMENT
This raises the question about whether the ranking system of the World Series of Darts represents the quality in the field, or is it a ranking system used to benefit the regional qualifiers?
The Number One Seed Record
Since its inception in 2015, the number one seed has won the event just three times, a 27.3% win rate. This means the top seed in eight years failed to win the tournament, suggesting form in the World Series rarely contributes to a win. This is no surprise, as the seeding system is based on the PDC World Series of Darts “Ranking Points” won at events that are spread across the tournament. This means that in the case of Stephen Bunting last year being top seed, he won events in Bahrain in January and Copenhagen in June.
This six-month gap followed by a 3-month gap from the World Series of Darts finals meant that, unlike the World Championship, where form in the months following the event often indicates the eventual winner, seen most clearly with the last 4 Grand Slams of Darts winners winning the World Championship in the next year, players despite being top seed don’t ride the same wave compared to other TV events.

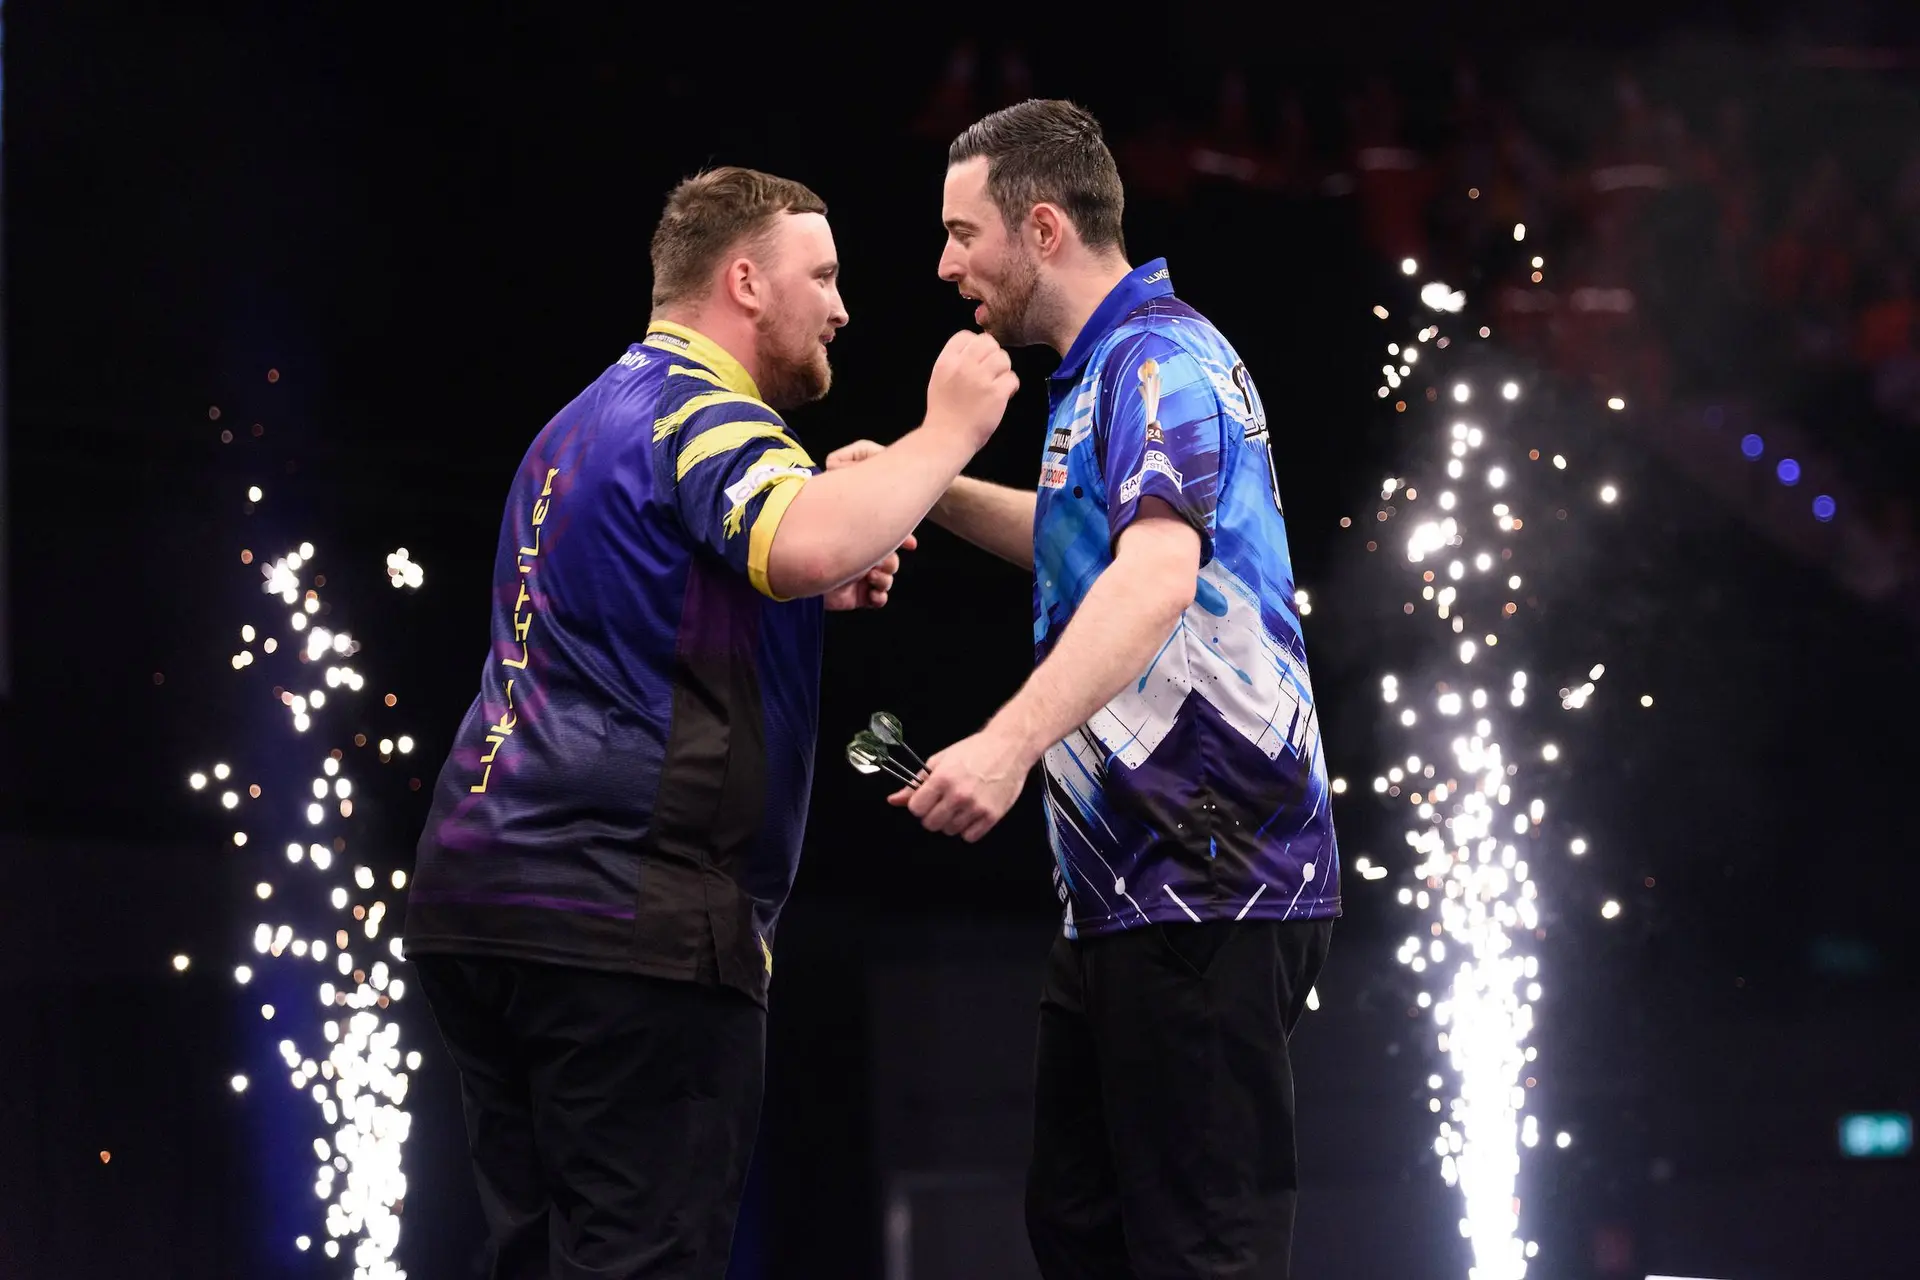
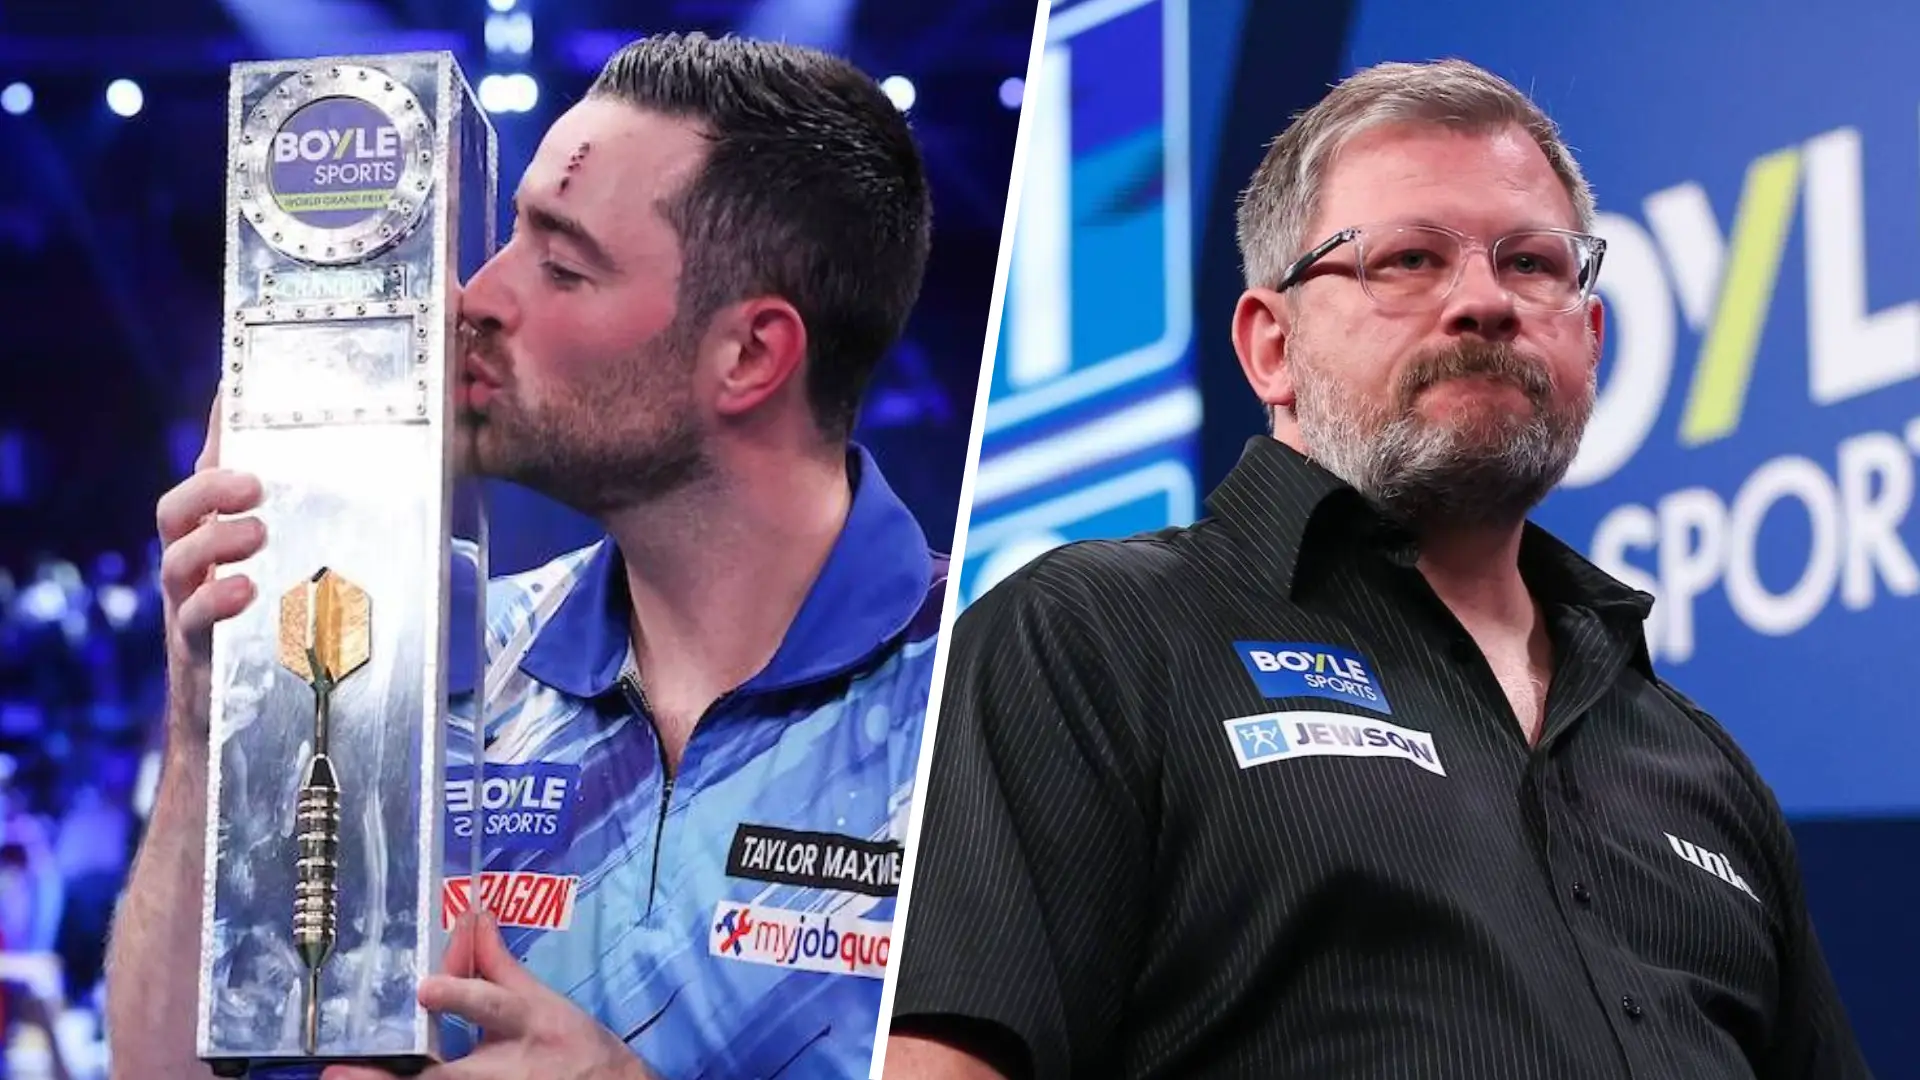
Luke Littler and Michael van Gerwen are former champions in this event.
The World Series of Darts Finals is also a non-ranking major, meaning player pressure is lowered, allowing for deep runs from players out of form or outside the top 4. In the tournament's debut in 2015, Phil Taylor was seeded one and lost to Michael Van Gerwen in the semi-finals, who was seeded three. From the players who have won when seeded one, Michael Van Gerwen takes two of the spots in 2016 and 2019, and with Littler in 2024, it can be argued that the World Series of Darts ranking system only dictates the draw, not necessarily the form. In both 2016 and 2024, Michael Van Gerwen and Luke Littler won the tournament and went on to lift the World Championship title, and in 2019, Michael Van Gerwen walked in as the World Champion.
This suggests the wider context of the form of players provides a much better indication of who is the favourite for the title, not the seeding like nearly all the majors in the darts calendar. In the wider sporting context, the top seed winning their event a quarter of the time would prompt serious questions about whether the seeding system is fit for purpose.
ADVERTISEMENT
This is seen with the number 1 seed winning roughly 60% of French Open titles during the Nadal era and top conference seeds capturing 60% of all Super Bowl rings over the last decade. In the World Championship, the top seed reaches the final ~40% of the time. With the World Series of Darts number 1 seed being knocked out in the second round as many times as they have won, it implies the seeding system may be outdated.
Number One Seed Record: Eleven Years
| Year | Seed One | Result | Winner | Winner Seed |
| 2015 | Phil Taylor | Semi-finals | Michael van Gerwen | 3 |
| 2016 | Michael van Gerwen | Winner | Michael van Gerwen | 1 |
| 2017 | Gary Anderson | Runner-up | Michael van Gerwen | 2 |
| 2018 | Peter Wright | Second round | James Wade | Unseeded |
| 2019 | Michael van Gerwen | Winner | Michael van Gerwen | 1 |
| 2020 | Michael van Gerwen | Second round | Gerwyn Price | 7 |
| 2021 | Michael van Gerwen | Semi-finals | Jonny Clayton | 4 |
| 2022 | Dimitri Van den Bergh | Second round | Gerwyn Price | 2 |
| 2023 | Rob Cross | Quarter-finals | Michael van Gerwen | 4 |
| 2024 | Luke Littler | Winner | Luke Littler | 1 |
| 2025 | Stephen Bunting | Runner-up | Michael van Gerwen | 10 |
Since 2015, the winner seedings have been: Seed one three times, Seed two twice, Seed four twice, Seed three once, and Seed 7 once, as well as Seed 10. Just once did a player unseeded win, with Machine James Wade in 2018 upsetting the odds. This constructs a median seed of three, with the top four seeds having won eight of eleven titles, suggesting a converse viewpoint that seedings are reflective of quality but not strongly predictive of where the players may finish.
This makes sense looking at 2026’s draw, with 2 of the top four players facing international qualifiers, showing a higher seed may grant an easier draw. However, seed five through eight hold the same privileges, but these players have won the tournament once despite representing some strong players. The tournament appears to reward either genuine top-four quality or a significant outlier performance, showing that the seeding system doesn’t predict who wins but predicts who may contend for the title.
ADVERTISEMENT
Winner Seedings: Distribution Across Eleven Years
| Winning Seed | Number of Times | Years |
| Seed 1 | 3 | 2016, 2019, 2024 |
| Seed 2 | 2 | 2017, 2022 |
| Seed 4 | 2 | 2021, 2023 |
| Seed 3 | 1 | 2015 |
| Seed 7 | 1 | 2020 |
| Seed 10 | 1 | 2025 |
| Unseeded | 1 | 2018 |
The Highest Average Paradox
The highest average player has won the World Series of Darts Finals four times from eleven years ago, a 36.4% win rate, just one more winner compared to number one seed. From the four of these results, Michael van Gerwen accounts for two and Luke Littler one, with all three also being among the stronger seeds in their respective years.

Michael van Gerwen is top seed.
ADVERTISEMENT
This means in seven of eleven years, the player producing the best darts across the tournament left without the trophy. The most extreme example is 2017, where Dimitri Van Den Bergh averaged 105.21, the highest individual tournament average in the eleven-year history, and James Wade won it, averaging 96.11. Wade's 96.11 winning average does not hide the 9.10-point deficit he overcame to win a major, which is almost unheard of in darts, yet at the World Series of Darts Finals it happened. 2022: Peter Wright averaged 103.11 and lost, and again Dirk Van Duijvenbode in 2023 averaged 103.20, again the highest, and lost.
Highest Average Player vs Winner: Eleven Years
| Year | Highest Avg Player | Their Avg | Winner | Winner Avg | Gap |
| 2015 | Michael van Gerwen | 105.66 | Michael van Gerwen | 105.66 | 0 |
| 2016 | Phil Taylor | 104.73 | Michael van Gerwen | 104.03 | 0.7 |
| 2017 | Michael van Gerwen | 101.86 | Michael van Gerwen | 101.86 | 0 |
| 2018 | Dimitri Van den Bergh | 105.21 | James Wade | 96.11 | 9.1 |
| 2019 | Nathan Aspinall | 103.37 | Michael van Gerwen | 101.98 | 1.39 |
| 2020 | Peter Wright | 103.58 | Gerwyn Price | 99.86 | 3.72 |
| 2021 | Dimitri Van den Bergh | 99.47 | Jonny Clayton | 98.69 | 0.78 |
| 2022 | Peter Wright | 103.11 | Gerwyn Price | 98.92 | 4.19 |
| 2023 | Dirk van Duijvenbode | 103.2 | Michael van Gerwen | 99.17 | 4.03 |
| 2024 | Luke Littler | 103.79 | Luke Littler | 103.79 | 0 |
| 2025 | Michael van Gerwen | 101.89 | Michael van Gerwen | 101.89 | 0 |
The explanation is in the format. The World Series of Darts Finals uses a leg format throughout, meaning every double attempt is a match-winning opportunity. A player averaging 103, finishing at 36%, is scoring brilliantly between missed doubles.
Read also

ADVERTISEMENT
A player averaging 97 finishing at 44% is converting the positions their scoring creates, and in a best-of twenty-one leg final, the finisher beats the scorer. In every year where the highest average player failed to win, the winner had a higher checkout percentage. The 2025 final proved this most visibly, with the losing finalist averaging 101.99 to the winner's 98.37, yet a checkout percentage of 47.83% versus 35.00% decided it. Neither the seedings nor the averages fully predict the winner. The doubles do.
Ben James is a darts writer at DartsNews.com, covering professional darts with a focus on analysis, player storylines, and match context. He contributes articles on tournaments, player performances, and developments across the PDC calendar.
Ben is currently completing his A Levels in History, Sociology, and Business, with predicted grades of A, A, and A. He also completed an Extended Project Qualification (EPQ), awarded an A grade, titled “To what extent do psychological factors and equipment specifications determine performance in competitive darts?”, reflecting a strong interest in the analytical and psychological aspects of the sport.
He has published early work on platforms such as Medium, including articles on Joe Cullen and Niels Zonneveld, and is developing his experience in sports journalism. Ben is also set to attend a PDC event, building first-hand insight into the professional darts environment.
His interest in darts spans player narratives, match dynamics, scoring strategy, and the mathematical and psychological elements of performance. In his writing, he focuses on clear structure, contextual analysis, and accurate reporting.
claps 0visitors 0
Just in


Popular news

Latest comments
- Assuming you qualify as one of the "muppets" in question. Classist too. And since you're so clearly interested in academia, look up "linguistic descriptivism" while you're at it. Oh, and better stay away from the working class sport of darts and maybe offer your insightful analysis to, let's say, croquet instead?Deduce635806-10-2026
- The consequences of being uneducated and grammatically challenged. "To all THOSE muppets not THEM " Everytime I see Arsepinall, I have an image of him wearing a cap, standing behind the counter of a fast food establishment.richieburnettrocks05-10-2026
- I don't understand Littler's reason for playing this tournament.rick6705-10-2026
- James Wade has become James Wide. He has piled on the tonnage considerably, he barely fits in his shirt.richieburnettrocks03-10-2026
- Littler will play whatever tournaments he decides. But does every headline have to start with him? Bristow bought Taylor through,and he followed that with Lewis. I can't see littler doing the same. Let him choose,and lose,he's getting good at that lately!rick6702-10-2026
- I believe he has it in him to qualify for the Worlds as he consistently wins matches, even if it is only one or two at a time, although his recent PC quarter-final run was somewhat encouraging in that regard. I think there is a lot of pressure for him to retire, people in the media accusing him of tarnishing his legacy. I think that is a ridiculous line of thinking. How ungrateful it is to attach terms and conditions to the amazing moments he has provided us over the course of his career. What position are we in to dictate to him how he should manage his career when it is he who achieved those successes in the first place? What's more, this is his life and the passion that sustains it, it is not for us to decide when his career is over when it is he who must bear the genuine ramifications of that decision. Since I'm sure money is not a concern, the only question on which the decision should rest is whether he truly continues to enjoy competing. He has retired once before, but the desire to compete is what brought him back. We see a lot of negative body language and he does genuinely look miserable when he is not playing well, but only he will know when he wakes up the next day whether he wants to go and do it all over again. If he wants to compete, he should, it's as simple as that, this is a decision that should not involve anyone else but him and his family. He should not retire to indulge the whims of the media or the public. What satisfaction would he receive by being forced into retirement? What closure would it bring to such a brilliant career? When Phil Taylor decided to retire, his decision was final and resolute. I believe RvB needs to get to this point himself, no matter how many 70 averages it might take. We see the likes of John Part continue to compete on a regular basis well past his prime, I say more power to him, and who knows, further glory could be around the corner, it's darts after all, you just never know. Sometimes I worry that RvB is acutely aware of the clamour for him to retire and that this pressure may even have an impact on his performances as he begins to question whether there is even a place for him in darts anymore, further compounding his poor form and creating a vicious loop. Perhaps to take his future into his own hands would provide him with a levity and freedom that would lend itself to better performances, not to mention an improved wellbeing. In any case, it is under these conditions that one can clear-headedly and definitively settle an issue so profound as retirement, not when you feel you're being rushed out the door. If his performances can no longer sustain his presence on the tour, so be it; as it stands his card seems safe for this year but is in serious jeopardy next year. He could always allow himself to drop off the tour naturally rather than forfeiting his place in the top 64, this could provide a sense of finality while offering a route back through Q-School if he so desired; after all, he's done it before. In conclusion, I just hope that RvB can play - or not play - for his own sake, rather than anyone else's, so that when the time comes he can be in no doubt as to his decision, leaving no lingering questions, so that he can reflect with no regret or uncertainty on the marvelous career he has had.Deduce635826-09-2026
- Luke Littler has been good for the sport of darts, no question. But he is not above it. For his sake and ours, he needs to be put in his place sometimes, rather than having his every whim catered to. That is not how you build a good person nor a good sporting organisation, and it's beginning to have consequences.Deduce635826-09-2026
- Extremely disappointing decision. It used to be that, along with major events and Euro Tours, the Players Championship series constituted one of three standards against which successful darts players could be measured, one of three challenges every successful darts player should be expected to master to consider themself among the elite. Now they are dead weight in the darting calendar, and player turnout and the standard of competitiveness will reflect that. The truth is that Luke Littler and other big names would rather play lucrative exhibitions than put in the hard graft that being a successful dart player requires. It undermines the authority of the PDC and the game in general. So what do they do about it? Give them exactly what they want. Of course, why wouldn't they? They are their star attractions. It is ironic that an organisation formed in protest by the sport's elite should be undermined and disrespected by their contemporary equivalents, but the PDC had a chance to stand up to them with a firm message: play 2 events all year and expect the final to be played without you. Instead, they caved in. These events will be hardly worth playing anymore and this decision may have grave consequences for the future of floor events at the elite level. Some may say the calendar is overstuffed, yet these elite players have more than enough time to play plenty of exhibitions. The Premier League in particular is gruelling, but busy players are not expected to play every event, they are expected to manage their playing schedule carefully in order to apportion their time and energy appropriately. Clayton and Humphries, for instance, both sit in the top 20 of the Players Championship and European orders of merit, in addition to competing in the Premier League; they have proven it is absolutely possible and this change is an insult to their efforts in effectively managing their calendars. I think we are seeing players who simply think they are too good for Pro Tour events, arrogance which should be punished rather than rewarded as we are seeing here. Furthermore, why should success in Euro Tours qualify you for the Players Championship Final? The PDC are blurring the lines between those three disciplines of darting excellence, and in so doing destabilising the very foundations upon which the organisation and its success is built. Some may say I'm overreacting, but this, in addition to the PDC's subservience and snivelling obsequiousness toward their biggest assets, makes me fear for the future of professional darts.Deduce635826-09-2026
- I guess this will mean the top players will turn up even less? Taken all the excitement of qualifying away I think. Wish they made it top 32 to qualify and the finals to last all week.Baphomet26-09-2026
- Great article - but not written by this site. It's taken wholesale from last Sunday's Observer with this interview published online on Saturday.Scoobedybop22-09-2026
Loading