ANALYSIS - Luke Littler vs Phil Taylor: Was darts really better in 2013, or is this a golden age in disguise?
PDCSaturday, 04 July 2026 at 13:30

A big calling point nowadays when it comes to the rise of Luke Littler is in fact direct comparisons to Phil Taylor and whether 'The Power' could've done it in the current pomp of 'The Nuke' and vice versa.
ADVERTISEMENT
In our latest analysis piece, we delve into the nuts and bolts of the leading pair and compare the annals of 2013 with 2025, when Littler gained serious prominence, and these comparison points. Were darts really better in 2013, or is it a golden age in disguise?
2013 vs 2025: Setting the Scene
2013, Phil Taylor had just won his sixteenth and final World Championship, picking up five major titles across the rest of the year. Dominance with ease. Taylor came up short in three televised majors that year: the Players Championship Finals and the Premier League went to Michael van Gerwen, while the European Championship went to Adrian Lewis.
Taylor dominated the PDC, and although a top eight stacked with quality, none of them ever looked capable of dethroning him. Taylor was world number 1, followed by Adrian Lewis, Wade, Whitlock, Andy Hamilton, Michael Van Gerwen, Wes Newton and Raymond Van Barneveld. Quality was evident throughout, but how does it match up to 2025? It’s the argument that surfaces whenever either name comes up. How would Littler do against Taylor? Who was actually better, and does it make sense to compare two players separated by over a decade of growth and evolution of this sport? The stats can help answer this.

Eighteen-year-old World Champion Luke Littler won six majors in 2025 and was undoubtedly the best player in the world. The youngest World Champion and Matchplay winner played the best darts that either stage has witnessed. Compared to 2013, the modern top 8 includes just two players still in the top 8, Wade and Michael van Gerwen, accompanied by Littler, Humphries, Gian Van Veen, Jonny Clayton, Gerwyn Price and Josh Rock.
Quality at the top of this list may not look superior to 2013 on paper, but it's hard to imagine Gerwyn Price losing to someone of Wes Newton’s standard. Yet, digging deeper, is that actually true, or is it a perception shaped entirely by Phil Taylor’s dominance over Newton specifically? Stats reveal that through 2013’s TV season versus 2025’s TV season, quality differs hugely in favour of the modern era. Higher averages and higher checkout percentages point towards a golden age. So does that golden age narrative hold up against Taylor himself, The Power, at his absolute peak?
ADVERTISEMENT

Now Littler jostles with Price, Van Veen and Humphries. Taylor did with Newton.
2013 vs 2025: The Top Eight Then and Now
| 2013 Player | 2013 Ranking | 2013 TV Average |
| Phil Taylor | 1st | 99.15 |
| Adrian Lewis | 2nd | 92.62 |
| James Wade | 3rd | 92.30 |
| Simon Whitlock | 4th | 92.06 |
| Andy Hamilton | 5th | 92.72 |
| Michael van Gerwen | 6th | 98.83 |
| Wes Newton | 7th | 90.36 |
| Raymond van Barneveld | 8th | TBC |
| 2025 Player | 2025 Ranking | 2025 TV Average |
| Luke Littler | 1st | 102.07 |
| Luke Humphries | 2nd | 99.12 |
| Gian van Veen | 3rd | 99.56 |
| Michael van Gerwen | 4th | 97.50 |
| Jonny Clayton | 5th | 95.66 |
| James Wade | 6th | 95.76 |
| Gerwyn Price | 7th | 96.77 |
| Josh Rock | 8th | 94.63 |
Before the Boards Get the Credit
ADVERTISEMENT
The 2013 dartboard had faults, and compared to the 2025 Winmau Blade 6 Triple Core, the faults are crystal clear. The 2013 board had knife-edge wires, meaning that bounceouts are more common, as well as the wires limiting the available scoring area. There is an approximate 14% larger effective scoring area on the modern Winmau Blade 6 Triple Core. 60-degree angled wires also reduce bouncouts, with the triple core retention system eliminating dropped darts. By 2025, and before the Blade X, bounce-outs were significantly less common than they had been with the Unicorn Eclipse Pro.
The triple sisal protection compared to Unicorn’s first layer leaves more room in the bed for tight grouping. Luke Littler's darts use the Swiss Point system at 42mm, allowing modern players to tailor their equipment to precise personal preferences. Modern-day grip points prevent the slipping that 2013's smooth points couldn't, suggesting that a portion of 2025's statistical improvement reflects equipment evolution as much as player quality.
Beyond that one-point threshold, equipment alone can no longer account for the remaining gap, meaning that, as a measure, the boards and evolution of the game account for roughly 1 point of the average increase. With this in mind, average differences and gaps that are marginal can be explained through modern-day technology. However, after the threshold of 1 point, the quality of modern-day technology can no longer explain quality differences.
Equipment Evolution: What Changed Between 2013 and 2025
| Feature | 2013 Unicorn Eclipse Pro | 2025 Winmau Blade 6 Triple Core | Impact |
| Wire design | Knife-edge, bounce-out prone | 60 degree angled, reduced deflection | Fewer lost turns |
| Scoring area | Standard | Approximately 14% larger effective area | Higher scoring potential |
| Dart retention | Single density sisal, prone to sagging | Triple core, carbon fibre backplate | Eliminates dropped darts |
| Board stability | Traditional centre screw | Rota-Lock levelling system | No vibration on impact |
| Point technology | Smooth, slipping prone | Swiss Point grip system | Prevents post-land slipping |
| Average impact | — | — | Roughly 0.5 to 1.0 points |
ADVERTISEMENT
Littler vs Taylor: The Numbers, Match by Match
Scoring Power: Averages, 180s and the Volume gap
The comparison between Littler and Taylor has been active since Littler’s heroics at the 2024 World Darts Championship. Ignited by his achievements and record-high averages, Littler has given the 16-time World Champion questions about his greatness. Through TV performances, Littler’s 94 matches against Taylor’s 58 reveal quite a shocking result that most dart fans wouldn’t expect.
In 2013, Taylor averaged 99.15 on TV, the best out of any player in this period and blew out all competition. Compared to Littler, a 2.92-point gap reveals itself with The Nuke averaging 102.07, closer than the eye test suggests but large enough to favour Littler in a game of 501.
Over the course of a single leg, this size equates to roughly half a dart fewer required on average to reach the same finishing position. Marginal in isolation, but compounding significantly across a twenty-five-leg televised match, small advantages accumulate into separation by the closing stages.
ADVERTISEMENT

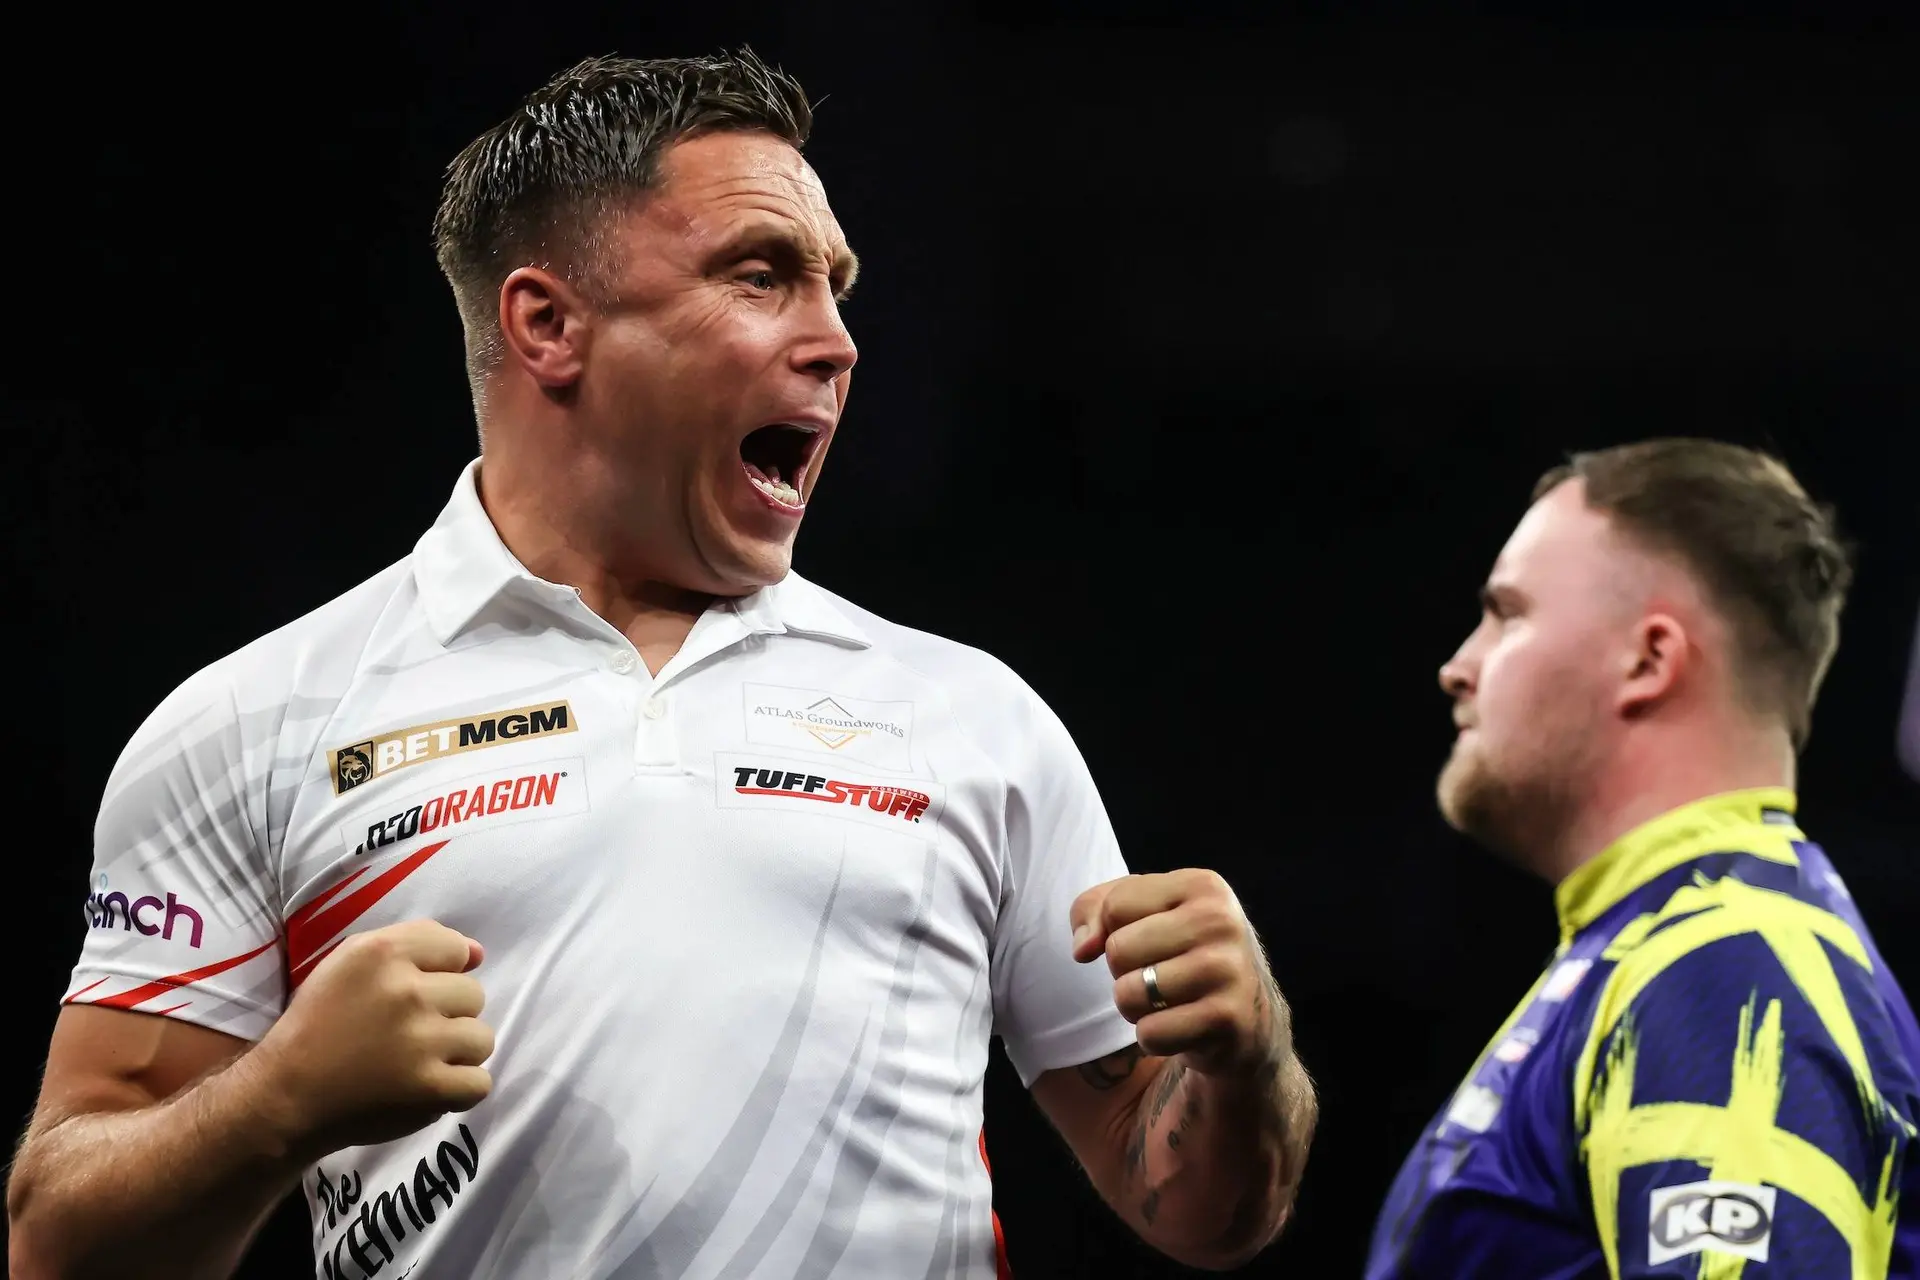
How does prime Phil Taylor compare with Luke Littler?
Although the first 9 and the first 3 are in Littler’s favour, both exceed 110 and aren’t high enough to give one or the other an advantage. The gap doesn't open up in the first exchanges of a leg, but accumulates across the full scoring sequence before a finish is required; this is where the 180 and 171-180 data becomes decisive to leave either player on a manageable finish before their opponent.
Littler is hitting significantly more 180s than Taylor, with a rate of 6.7 per match against Taylor's 3.2. Littler played 60% more matches but hit three times more 180s, meaning the volume gap isn’t simply down to extra matches played. It reflects a genuine shift in how often the very best players are finding the treble twenty under pressure. None of this settles the argument on its own. Comparing Littler’s greatest attribute to Taylor’s equivalent strength only tells half the story. The other half is what happens when a player needs a specific number rather than the biggest one available.
Finishing Under Pressure: The Checkout Parity
Taylor was never a power scorer, with his checkout percentage showing Taylor’s real quality. Taylor was the best finisher in the world in 2013 with a 43.62% checkout percentage, but compared to Littler’s 2025 checkout percentage, Taylor beats out the 4th-best 2025 checkout percentage by 0.01%. Average measures how well a player scores. Checkout percentages measure how well a player closes a leg out; a test of nerve with titles on the line.
ADVERTISEMENT
By that measure, the gap between the two eras doesn’t exist. That figure that shows Taylor’s checkout percentage, which won him games, is pretty identical to the 4th-best in the world, showing the quality difference in favour of 2025. However, with 13 years of evolution, it hasn’t moved the needle for the very best players, but Littler's strength lies elsewhere, meaning his checkout percentage is an additional quality rather than his defining one, whereas for Taylor it was everything. In terms of consistency, either player hit just one match below a 90 average in their respective seasons, meaning neither player had a genuinely poor day on a big stage.
The ceiling of quality has lifted; therefore, Littler is brought to play at a higher standard, seen with his 171-180 shots, where these 171s that set up shots prove greater importance under pressure in order to leave a finish before their opponents. The two-time World Champion hit 632 171-180s in 2025; Taylor hit 81 in 2013. In 2013, Taylor’s approach of outscoring opponents using 180s and 140s often led to leaving acceptable bogey numbers. With 2025’s evolution, 171 shots are no longer an option, meaning that, as an independent comparison, Littler vs Taylor may be flawed.
The quality varies and is evident in career nine-darters. This adds another layer, as although Taylor’s 18 nine-darters over a 27-year career sit higher than Littler’s 13, in 2 and a half years, Littler’s quality and talent mean that Littler, in the time of a year, may surpass Taylor’s record. The same pattern emerges with their 100+ average frequency, as Taylor averaged 100+ in 64% of his matches, whilst Littler, in 67% of his matches, averaged over 100. In a harder field, across thirty-six more matches, maintaining a higher ton-plus average demonstrates the scale of Littler’s quality. This is the clearest evidence that nerve was never a limiting factor for either man's performance. On precision alone, then, era means almost nothing. Where two players diverge is in how many darts each of them had to play to prove their quality.
The Power vs The Nuke: TV Season Head to Head
ADVERTISEMENT
| Metric | Phil Taylor 2013 | Luke Littler 2025 |
| TV Matches Played | 58 | 94 |
| Average | 99.15 | 102.07 |
| First Nine Average | 110.56 | 112.14 |
| First Three Average | 108.76 | 110.19 |
| Checkout % | 43.62% (1st in world) | 43.61% (4th in world) |
| Win % | 81% (47/58) | 81% (76/94) |
| 180s | 190 | 587 |
| 171-180 Visits | 81 | 632 |
| Below 90 Averages | 1 from 58 | 1 from 94 |
| 100+ Average Matches | 37 from 58 (64%) | 63 from 94 (67%) |
| Nine Darters | 18 career | 13 in 2.5 years |
| First Major Win Age | 29 | 17 |
Win Percentage, Workload and the Career Trajectory
Although players such as Price or Rock may push Littler to a higher standard than Wes Newton or Andy Hamilton, this doesn’t mean Taylor can’t perform to Littler’s level. The win percentage data settles the question more convincingly than any metric could. Taylor’s win percentage against such players sits at 81% on TV, and in a worse field, Littler matches with the same win rate exactly. Thirty-six more matches. Thirty-six more chances to lose.
Taylor’s dominance is partly a product of playing fewer matches against a thinner field, meaning that this perception is built through playing against a lower quality of darts as well as playing fewer matches against them.
Thirty-six additional matches is the equivalent of an entire extra season worth of televised darts, played against a field that by 2025 included more genuinely dangerous floor and TV players than existed in the whole of 2013. Therefore, Littler’s sustained win percentage points towards a more superior dominance, despite the greater losses as a result of playing more matches. Winning his first major at 17, Taylor didn’t win until 29, showing a 12-year advantage in Littler’s favour. At Taylor’s current trajectory when he was eighteen, his sixteen world titles were over a decade away; Littler has already banked thirteen majors before turning twenty.
ADVERTISEMENT
The trajectories aren't comparable, making Littler’s peak at 18 more remarkable and making the scale of his achievement one of the most extraordinary sport has produced. Is there room for growth? Can Littler find a new gear in his game? Yes, he can, but even without improvement, Littler is producing numbers that no player at his age, or arguably any age, has matched. None of that diminishes what Taylor achieved with the tools, competition and sports science available to him at the time; it simply means the ceiling Littler is operating sits higher than any era has produced before.
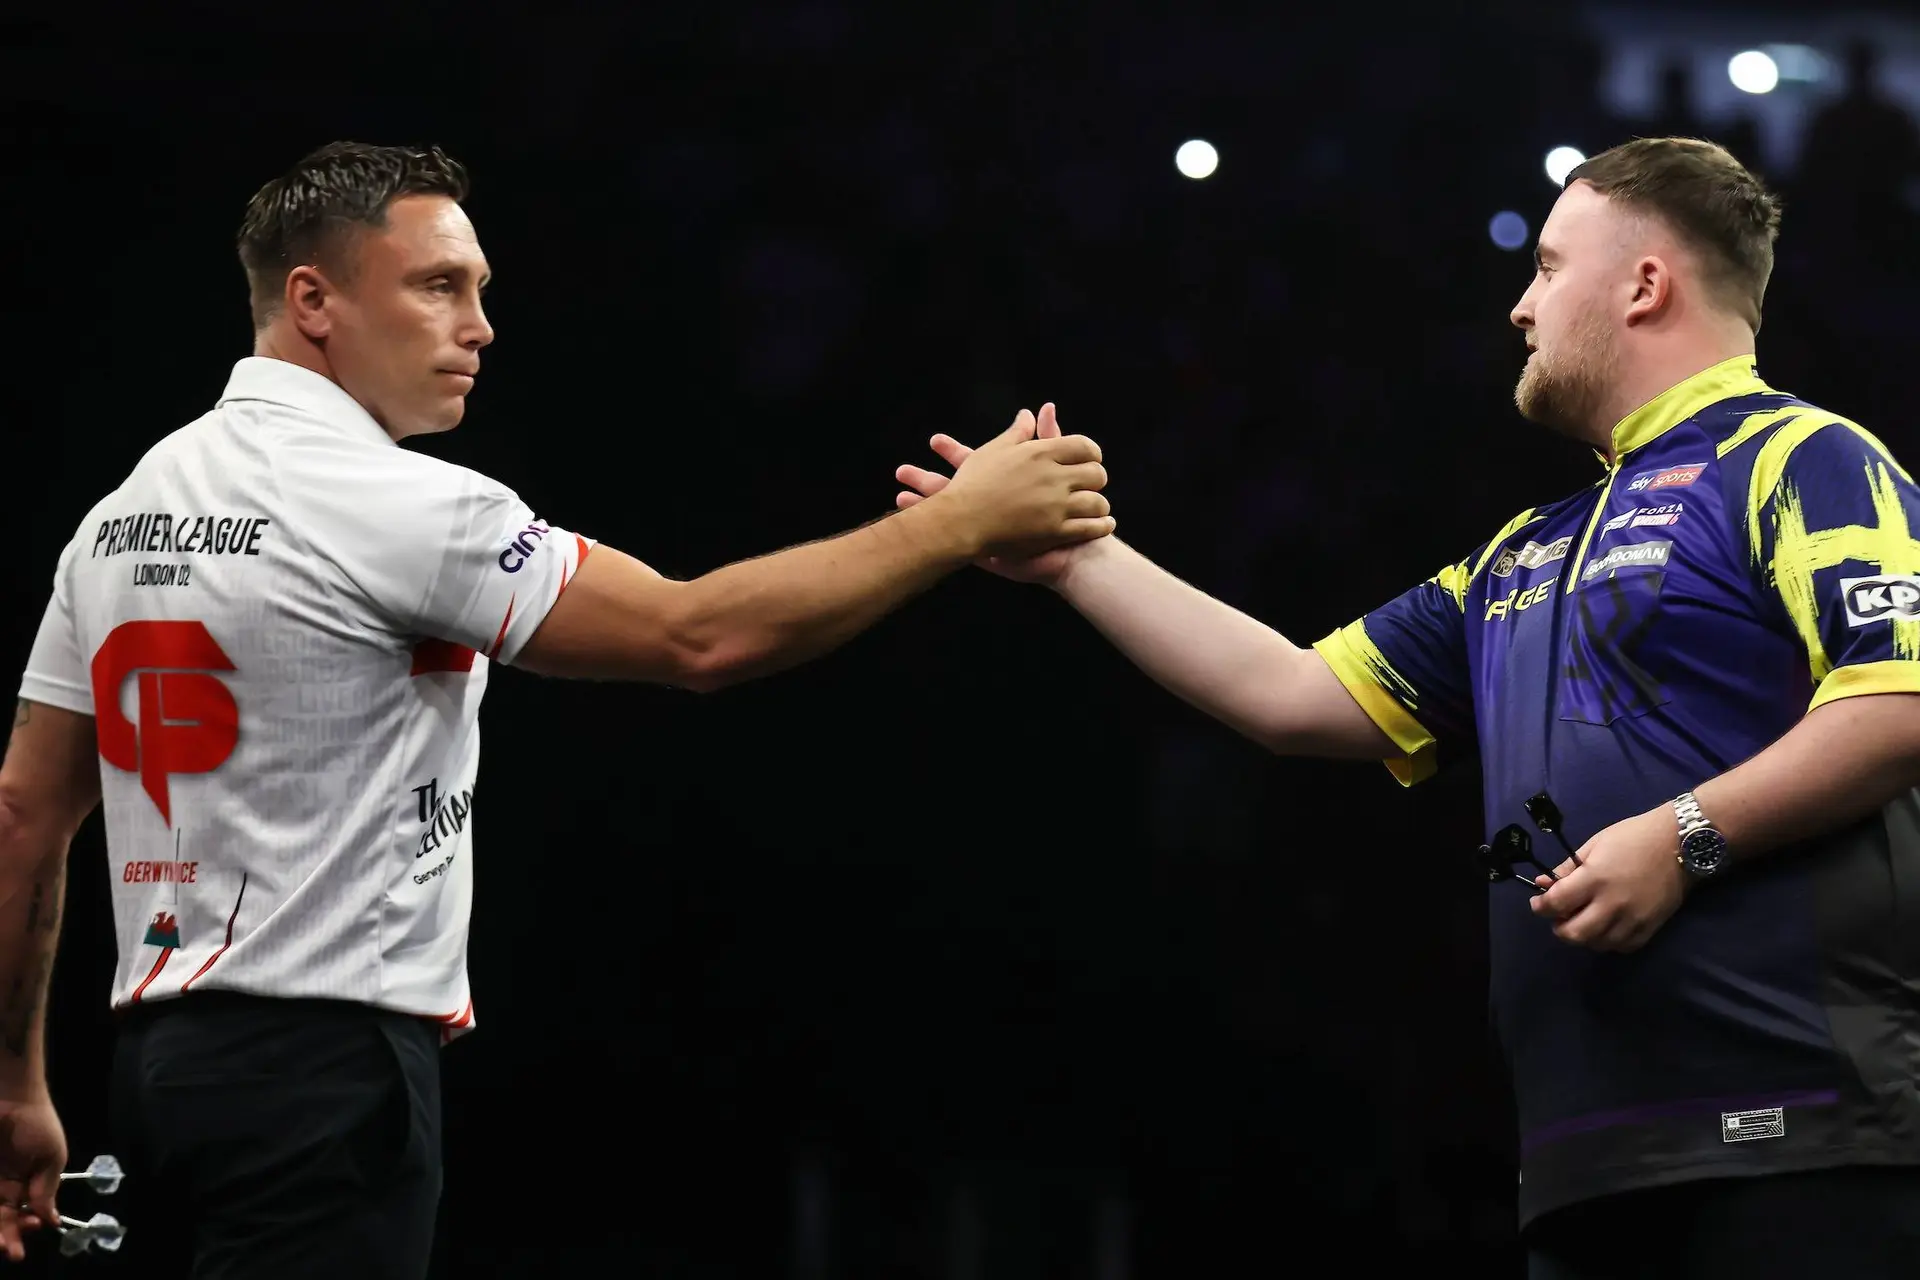
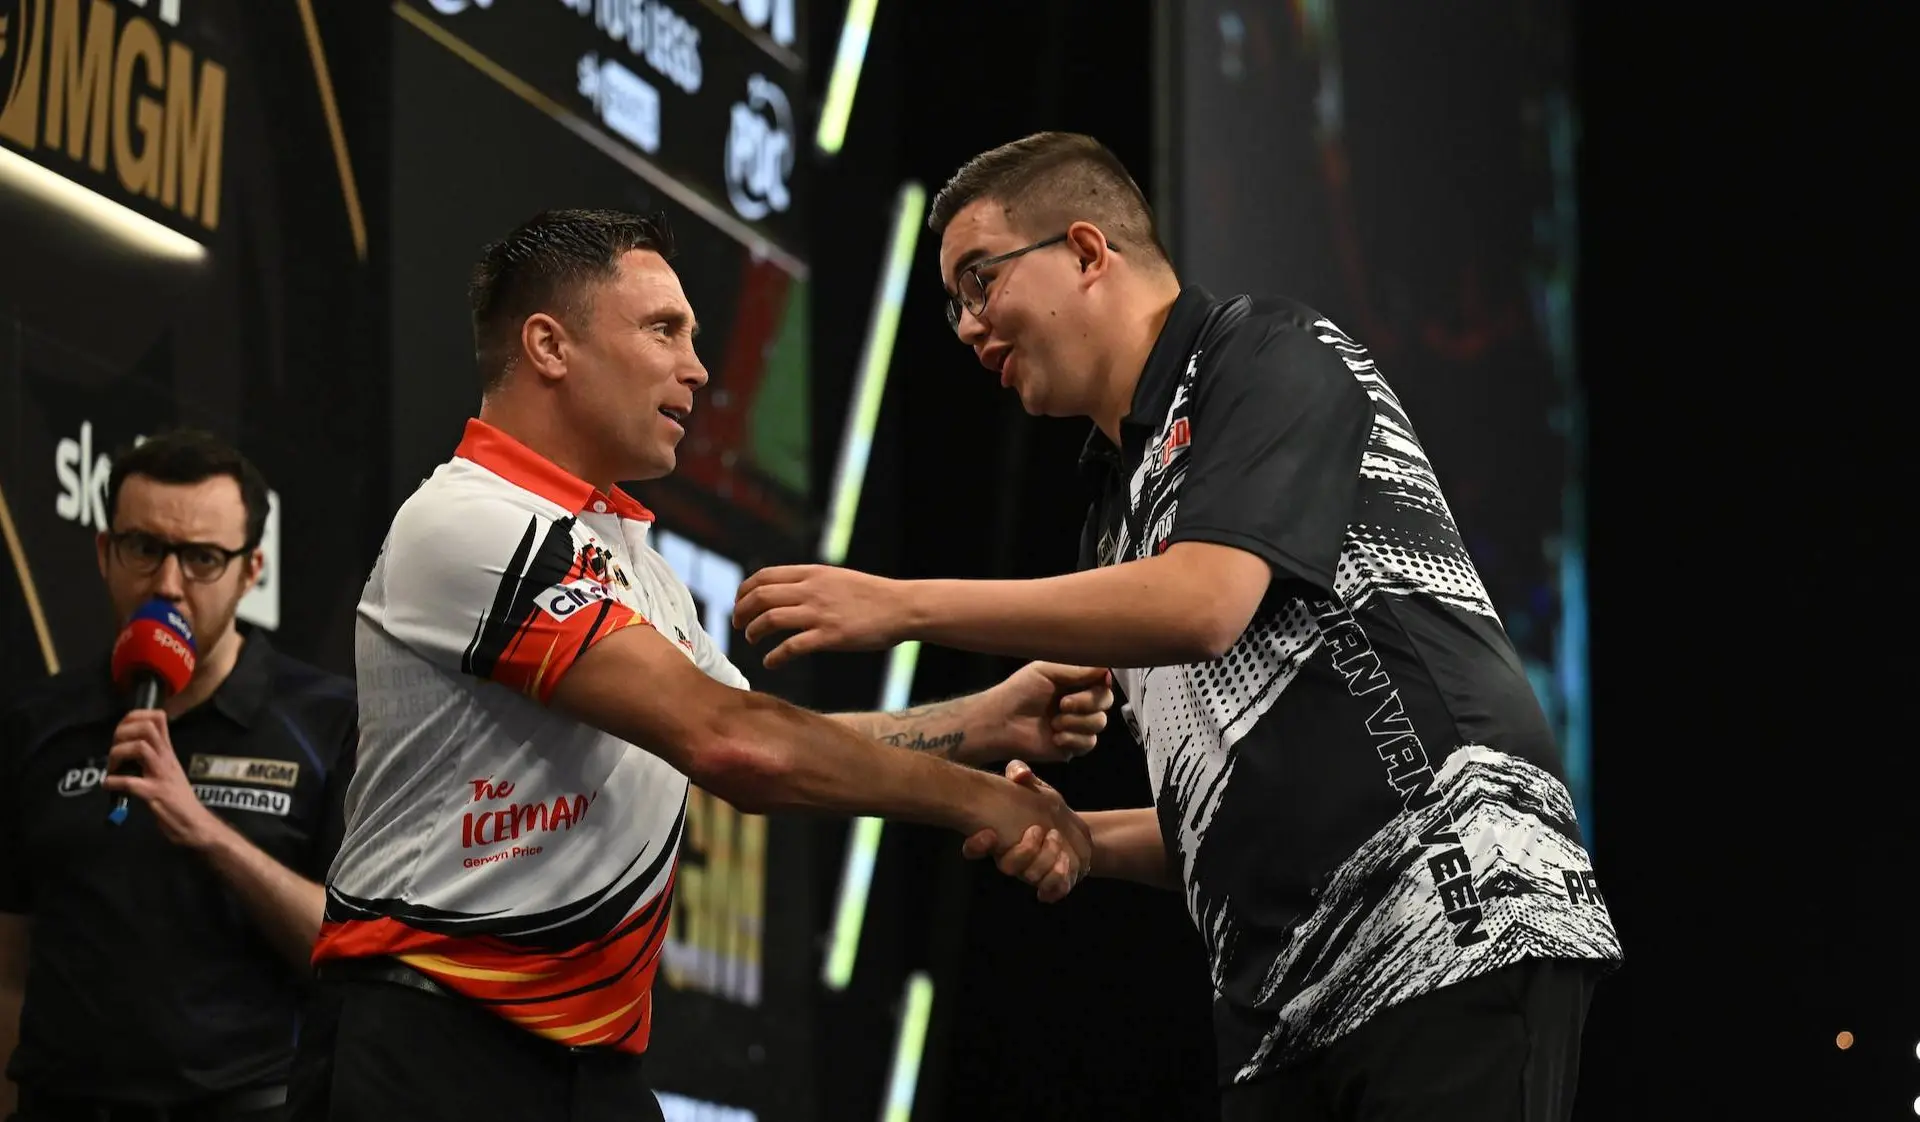
Littler's temperament is still developing, as the Manchester incident with Gian van Veen in the 2026 Premier League demonstrated: a crowd dispute, a cry-baby gesture and weeks of booing that followed him across European cities before he rebounded to win the title.
Taylor would never have allowed the crowd to get inside his head in that way. But Littler was eighteen, and the fact that he won the tournament despite the hostility suggests the mental foundation is already stronger than the incident implied. On all metrics, Littler is showing possibilities for growth, whilst beating Taylor in these stats during this development curve. Taylor never had the opportunity to prove his dominance against a field this demanding.
The field caught up and the money explains why
Twelve players averaged over 90 on TV in 2013. 77 players averaged over 90 on TV in 2025. The quality on TV, the biggest representation of darts globally, hasn’t just changed; it has drastically shifted into a sport of higher quality. Players averaging over 95 were just four on TV in 2013; in 2025, there are twenty-five. These statistics reveal that this wasn’t a golden age of darts compared to 2025 at all; that quality was masked by the explosion of Michael van Gerwen's emergence and the drama it produced, and explosive games such as the 2013 Grand Slam of Darts.

Van Gerwen has endured an inconsistent 2026 so far.
These moments mask the fact that the sixth-best average in the world in 2013, 92.72, isn’t better than the forty-sixth-best player on TV in 2025. Wes Newton would struggle to keep a tour card with a 90.36 TV average in 2013. Only Wade and Michael Van Gerwen survive from 2013. Michael Van Gerwen’s average lies just 1.33 points ahead in 2013 compared to today, where the direction of his career is only looking down. He had the second-highest average in 2013; now just the ninth. But why? Why has darts exploded in quality and blown what many said was the golden age in 2013 and the highest peak of darts?
The Financial Transformation: What the Prize Pool Became
| Metric | 2013 | 2025/2026 | Increase |
| World Championship total fund | £1,000,000 | £5,000,000 | 5x |
| World Championship winner | £200,000 | £500,000 | 2.5x |
| First round loser | £6,000 | £15,000 | 2.5x |
| Full season prize pool | £5-6 million | £25 million+ | Roughly 5x |
| Players Championship per event | £50,000 | £125,000 | 2.5x |
Losing in the first round of the 2013 World Darts Championship would pay out £6,000. In 2026, this same result would pay £15,000. The 2013 World Darts Championship had a prize fund of £1 million. The World Championship fund alone quintupled to £5 million, and the full season prize pool grew to over £25 million. Talent alone and the increasing quality of players can’t explain the improvement in darts. There is simply more money to be won, and with greater financial incentive, an increase in performance is completely linear. More children grow up to be darts players with academies rather than pubs, diets rather than takeaways and sports psychology rather than superstition.
This newfound professionalisation, enabled by increased money, fundamentally transformed the game into one of the largest sports in Britain, producing a new wave of players who arrived on the tour more technically refined and mentally equipped to post higher averages. Krzysztof Ratajski's current TV average would have placed him inside the top five in 2013. Money manufactured the desire to drive excellence, building the conditions for a higher quality game.
The moments will always be remembered: Taylor, Lewis and van Gerwen on the same stage, fighting one another for the titles that defined an era. But with this comes the fifth seed of the 2014 World Darts Championship, Andy Hamilton. The statistics reveal that when battling against the top 4, averages were higher than today, and drama was filled with memorable matches, personified in the 2013 Premier League Final and the 2013 World Matchplay Final, having a mean average of 106.35, contrasted by 2025’s average in the same finals of 101.75; the quality is spread out.
The top 4 in 2013 weren’t required to perform their best in the earlier stages of tournaments. The top 4 in 2025 are required to perform at 100%, as the unseeded players in tournaments such as the Matchplay currently sit inside the top five of 2013. Technology evolves, prize money grows, and quality follows. This linear scale explains why the quality of darts in 2025 is currently at an all-time high compared to Taylor’s twilight and Lewis’ peak. Taylor dominated a sport that hadn't yet discovered what it could become. Littler is dominating the version it has.

Ben James is a darts writer at DartsNews.com, covering professional darts with a focus on analysis, player storylines, and match context. He contributes articles on tournaments, player performances, and developments across the PDC calendar.
Ben is currently completing his A Levels in History, Sociology, and Business, with predicted grades of A, A, and A. He also completed an Extended Project Qualification (EPQ), awarded an A grade, titled “To what extent do psychological factors and equipment specifications determine performance in competitive darts?”, reflecting a strong interest in the analytical and psychological aspects of the sport.
He has published early work on platforms such as Medium, including articles on Joe Cullen and Niels Zonneveld, and is developing his experience in sports journalism. Ben is also set to attend a PDC event, building first-hand insight into the professional darts environment.
His interest in darts spans player narratives, match dynamics, scoring strategy, and the mathematical and psychological elements of performance. In his writing, he focuses on clear structure, contextual analysis, and accurate reporting.
claps 1visitors 1
Just in

Popular news

Latest comments
- Sophie is an excellent player and an exciting talent. I would have thought such a talented player would certainly be ranked higher than 17. It will be great to see her back at Lakeside and hopefully becoming champion.richieburnettrocks21-07-2026
- How many times can fatty Bunting say listen, listen, listen....... I definitely don't want to see him for another 10 years, although looking at him, I don't think we will...you know what I mean.richieburnettrocks19-07-2026
- Don't worry Vinman, England will not be in the final.richieburnettrocks16-07-2026
- Ultimately, Vin man knew when to call it quits. Barney was excellent and one of the greatest darts player ever, but he just doesn't have that ability anymore. Vinman working in media is only saying what he thinks and I like how he doesn't sugar coat things and is completely honest and direct with his comments. Vinman will probably agree he wasn't really on the same level as Barney in their respective heydays.richieburnettrocks13-07-2026
- I agree that this season the format was a bit stale, it would be better to have some new faces rotated in through the season. I also think they should vary the format a bit as it doesn't count for rankings, they could have different varieties of 501 (e.g. double start) or just different challenges.mikedarts03-07-2026
- I don't really understand why its an issue that Littler doesn't play in the events, they are barely televised so there is no draw for marketing and it gives the other players a better chance to define their narratives. The events are more of a throw back to old events. I agree that the format should be looked at, I don't know why they don't do a more interesting format or vary it through the season to improve interestmikedarts03-07-2026
- This shows they have the prize money structure wrong then (and OoM as a result). Put more £ into the floor, less on the TV and you'll attract more players to attend more often.BandB03-07-2026
- He's admitted his mistakes. He won't be the first or last player to get sent down,or take drugs. I honestly didn't like the lad,but at least he's owning up to his issues. So,good luck. In whatever he decides to dorick6702-07-2026
- Not everyone wants to watch pub players throwing 70 averages for about £500. Premier League is indeed a cash cow, but it does its job of promoting the game. This new suggestion for changes is one of the better ones. Even better if everyone knew what they had to do to qualify and it isn't just a walk-on popularity contest.StraightArrowNoBull01-07-2026
- I have a suggestion,scrap the whole thing. It's a pointless cash cow for anyone in the top 10.rick6730-06-2026
Loading